ICICI Stock Analysis
This is a basic analysis of ICICI Bank stock price. These images are output of my jupyter notebook on my system.
We can change to any stock and generate same images.
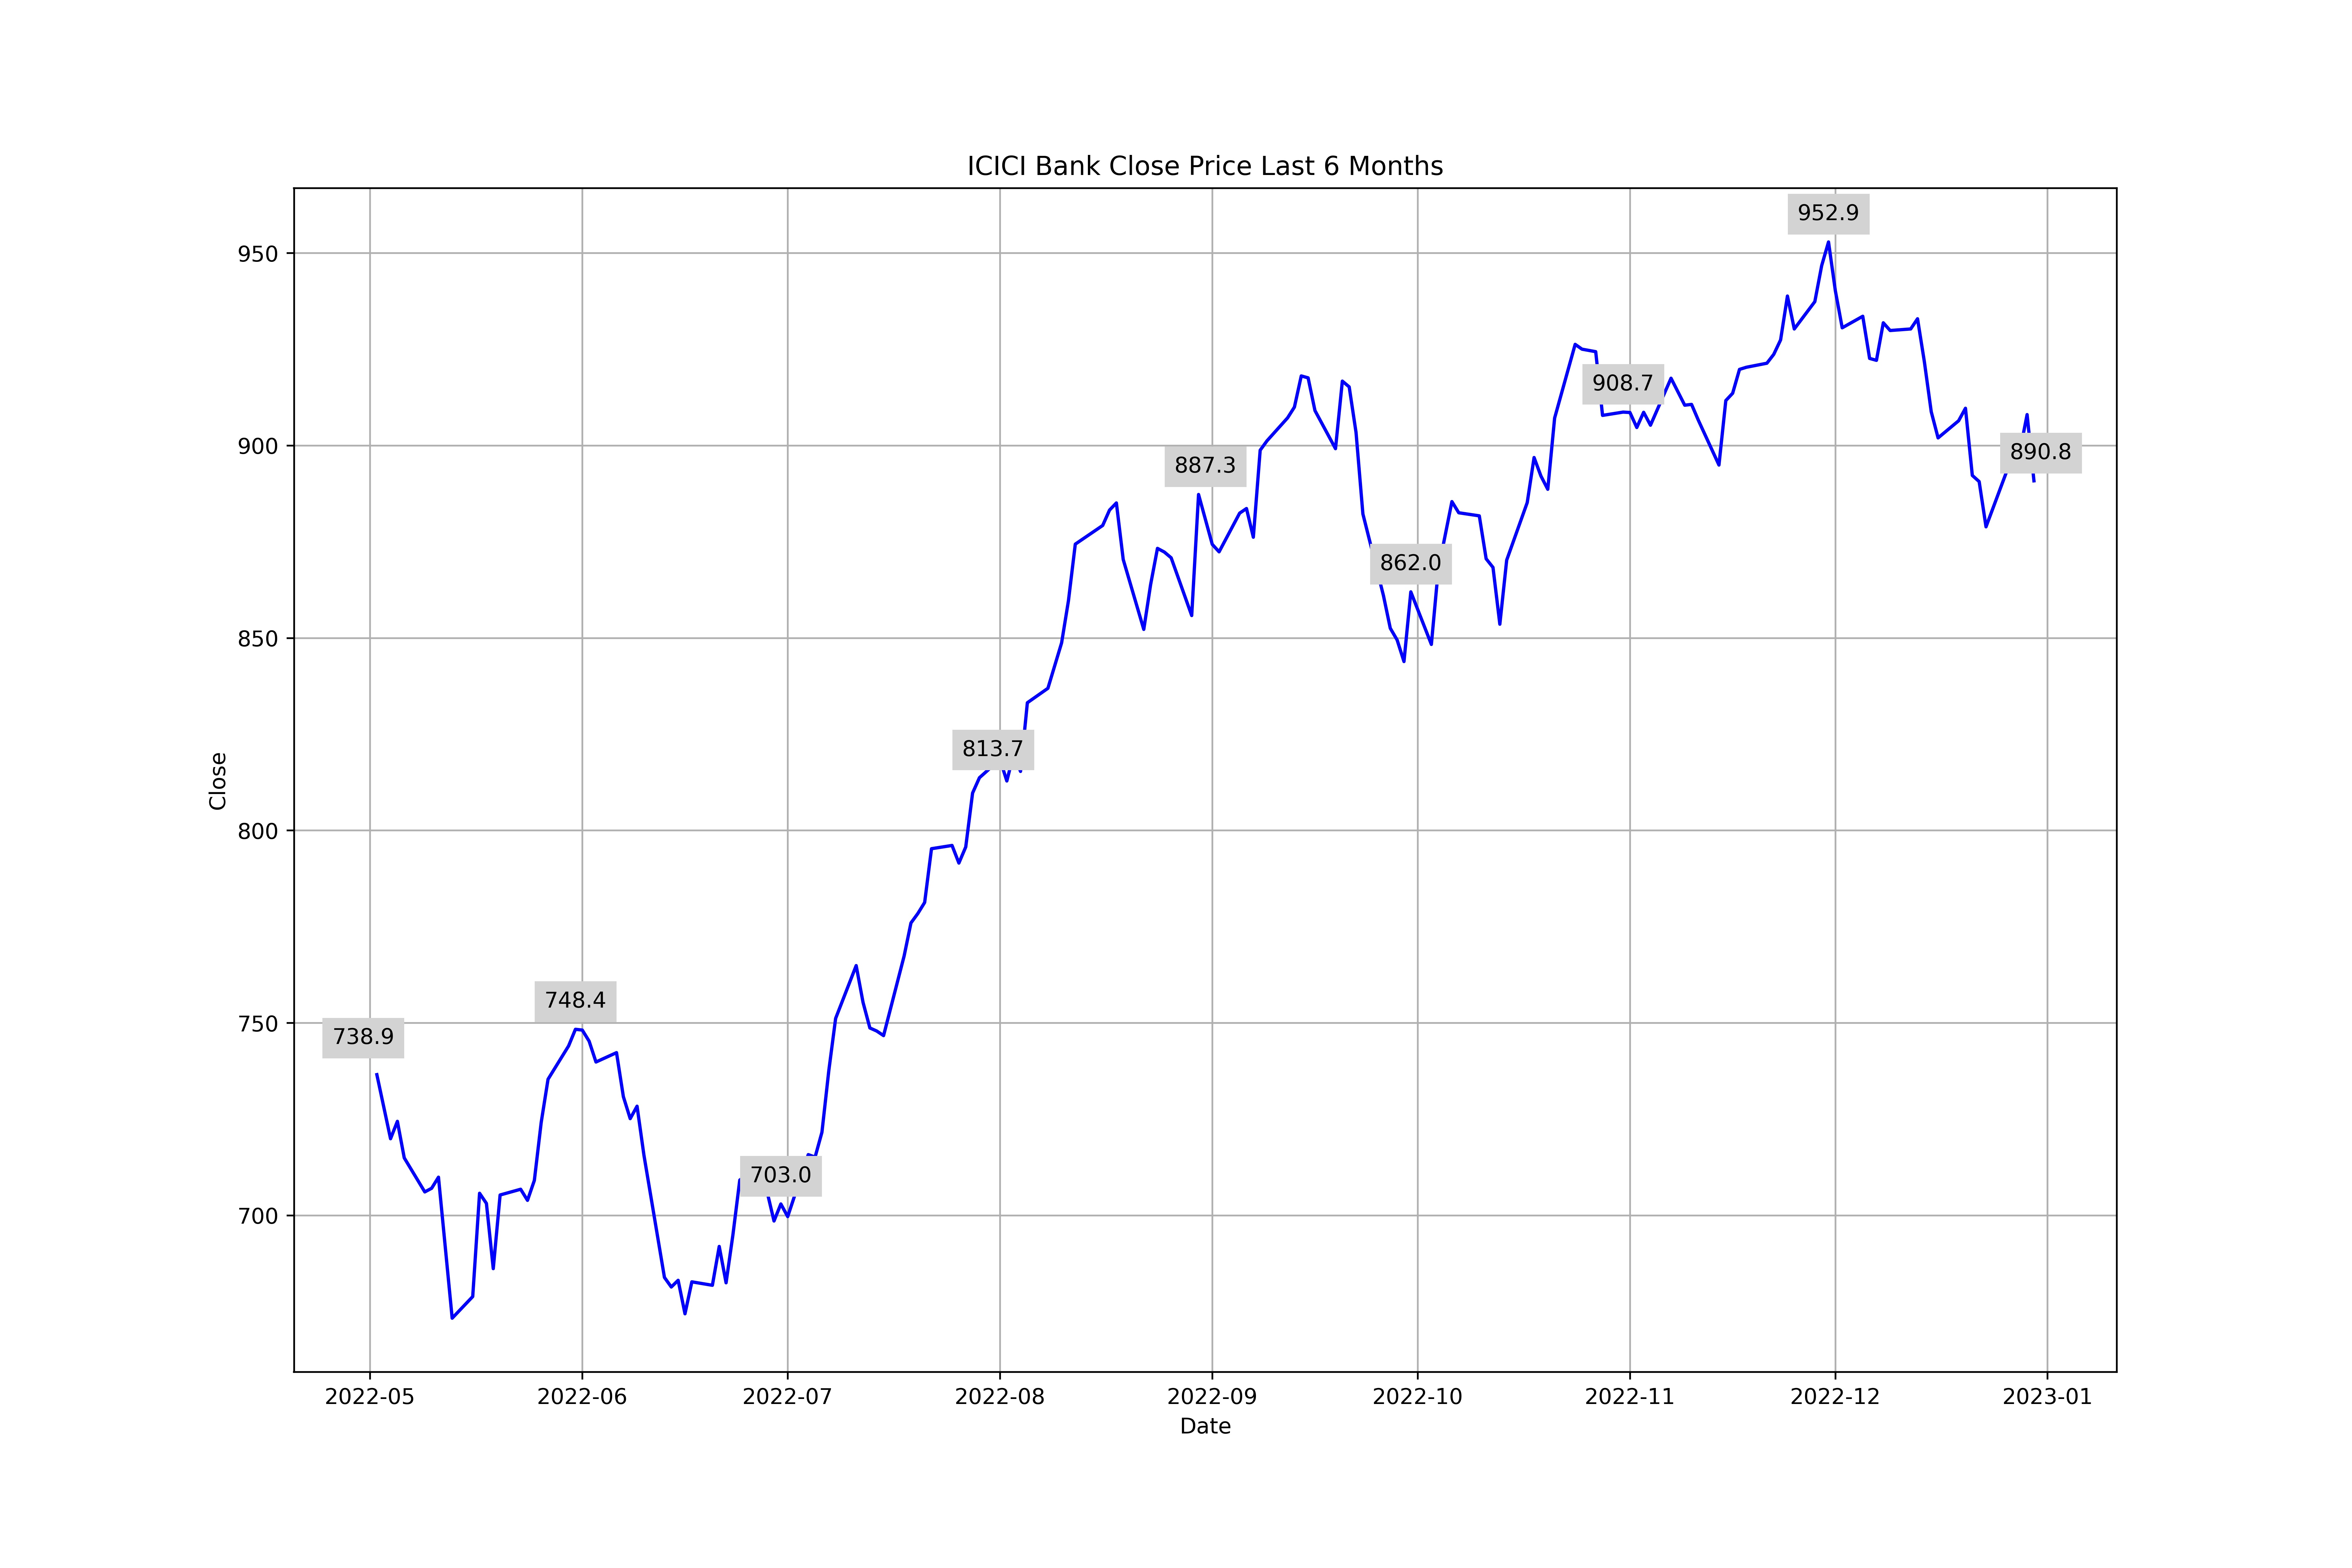
Last 6 months close price
Close price for every day for last 6 months.

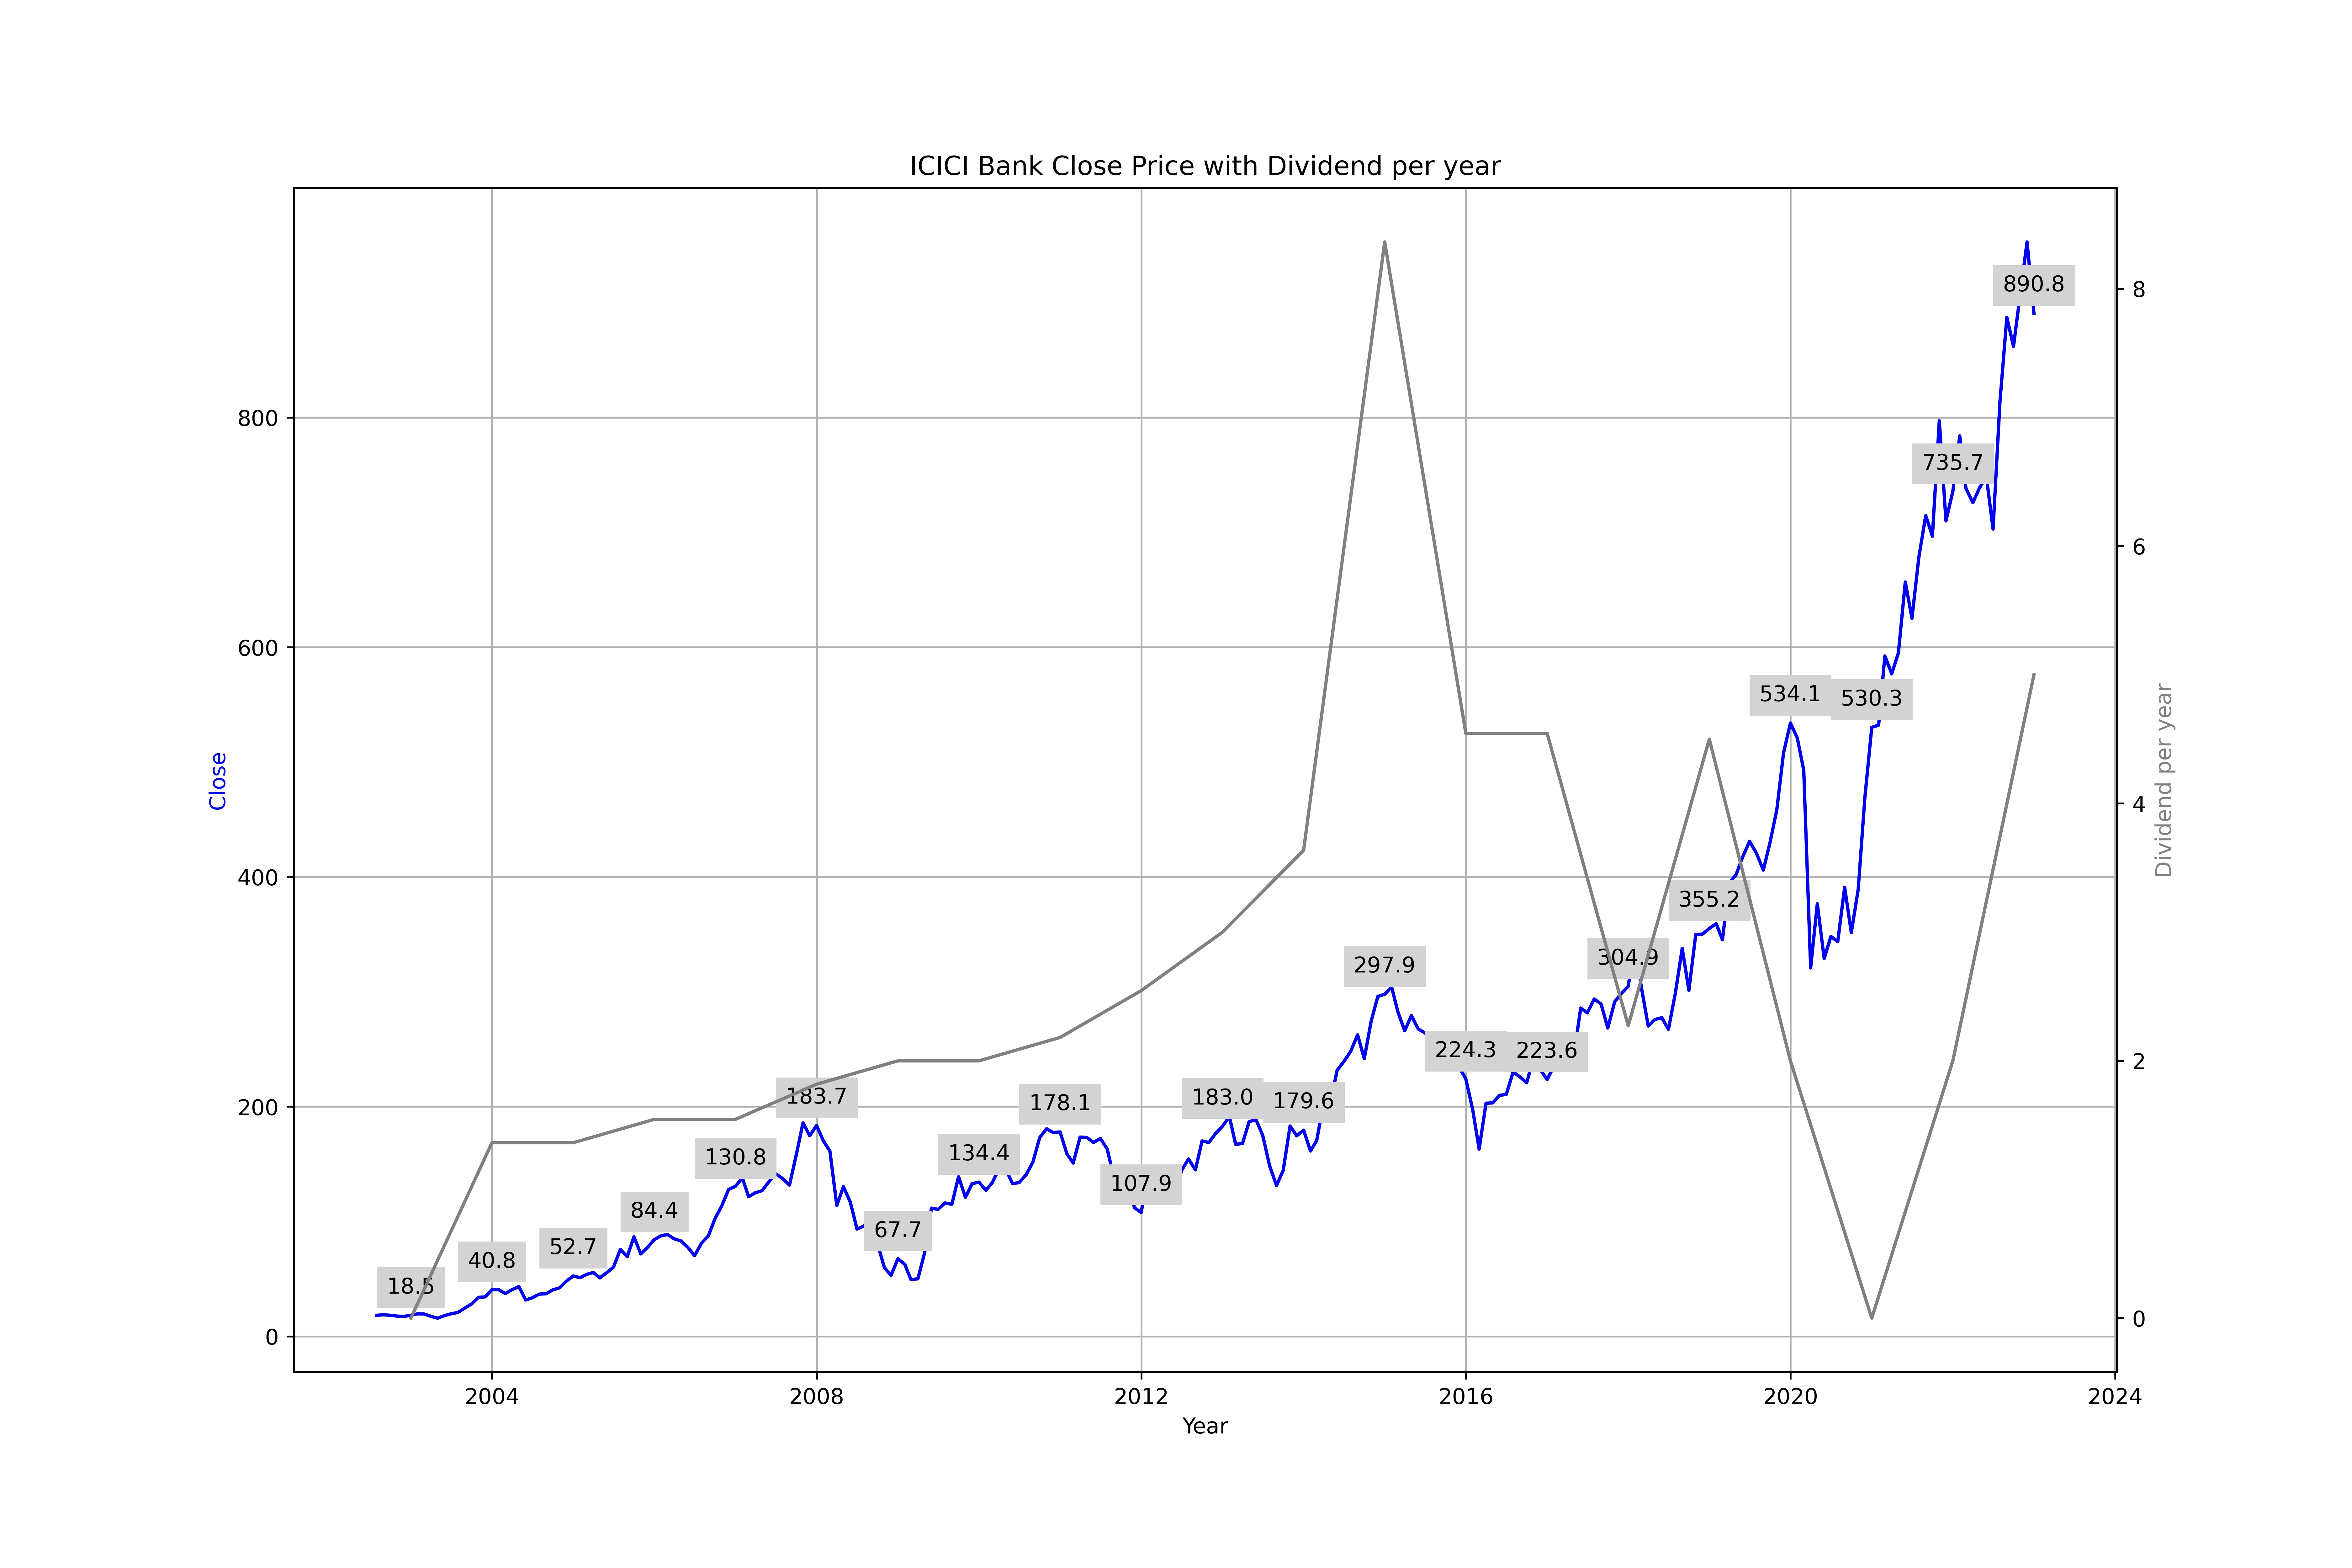
All time close price monthly
Close price for every month for all time with total dividend per year.

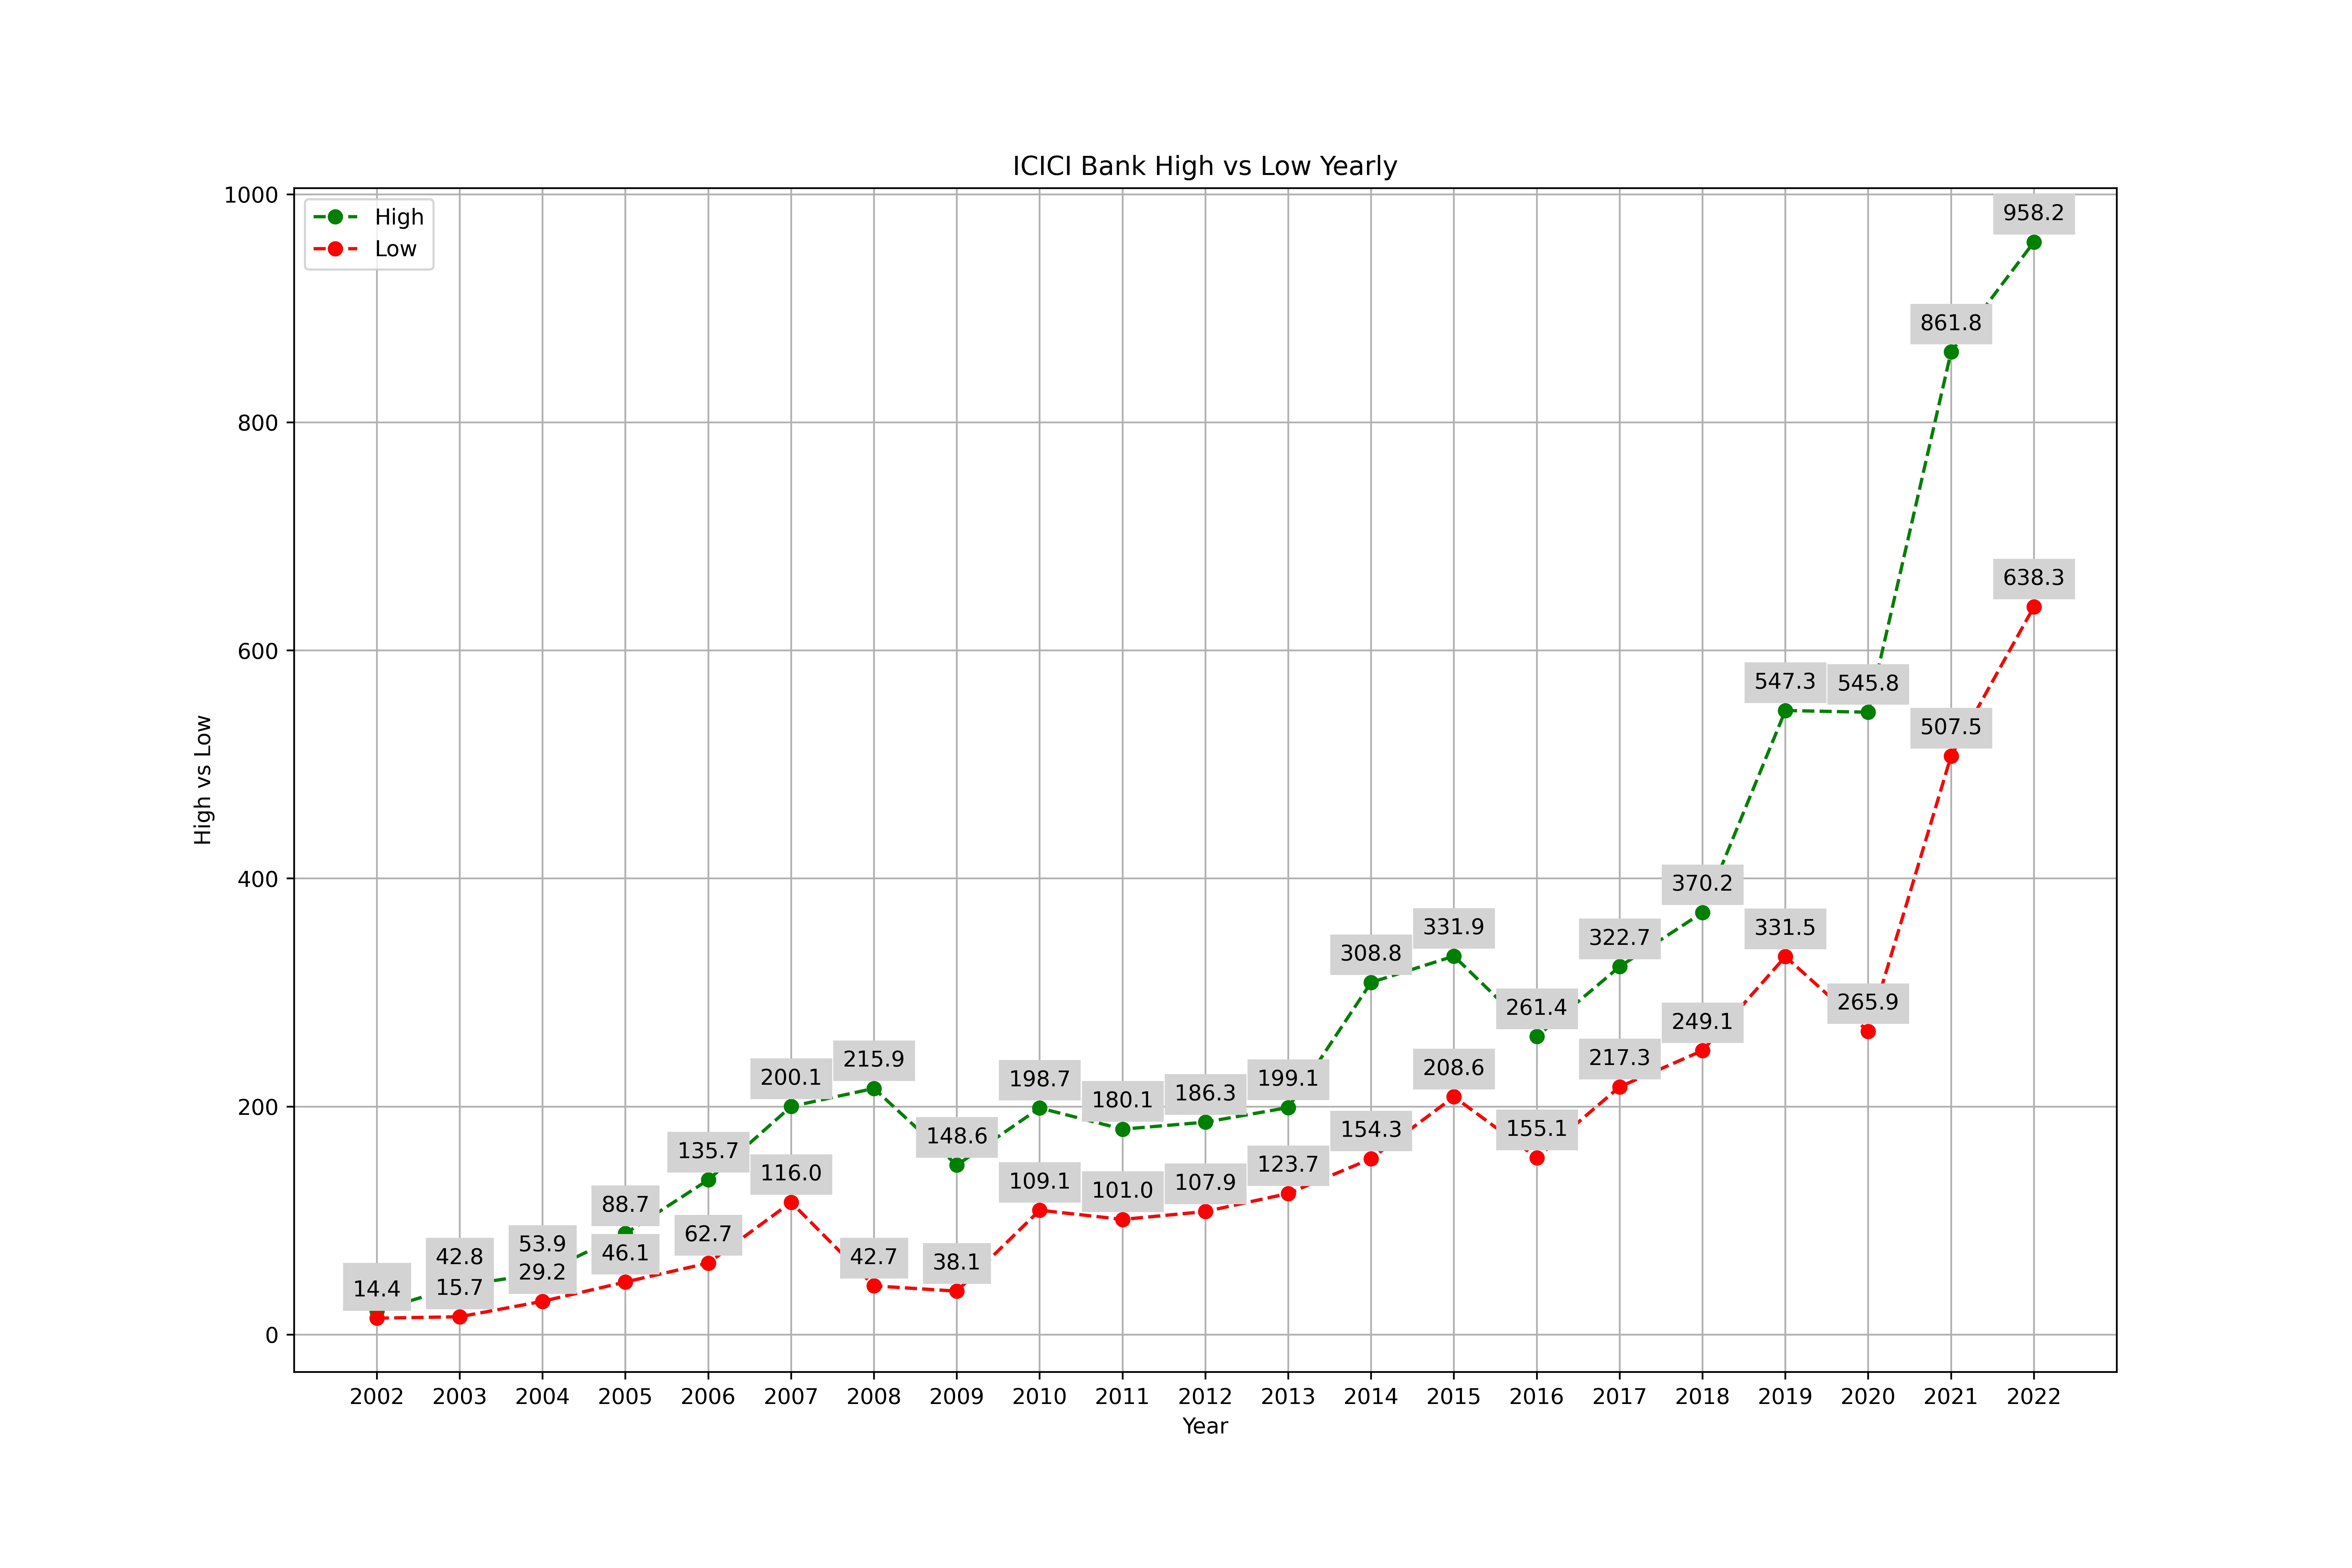
All time high vs low
This is most interesting chart. High vs Low price for every year, if suppose you buy shares for any amount near to low price in a year and sell same next year near to high price, you can calculate investment return from following chart.

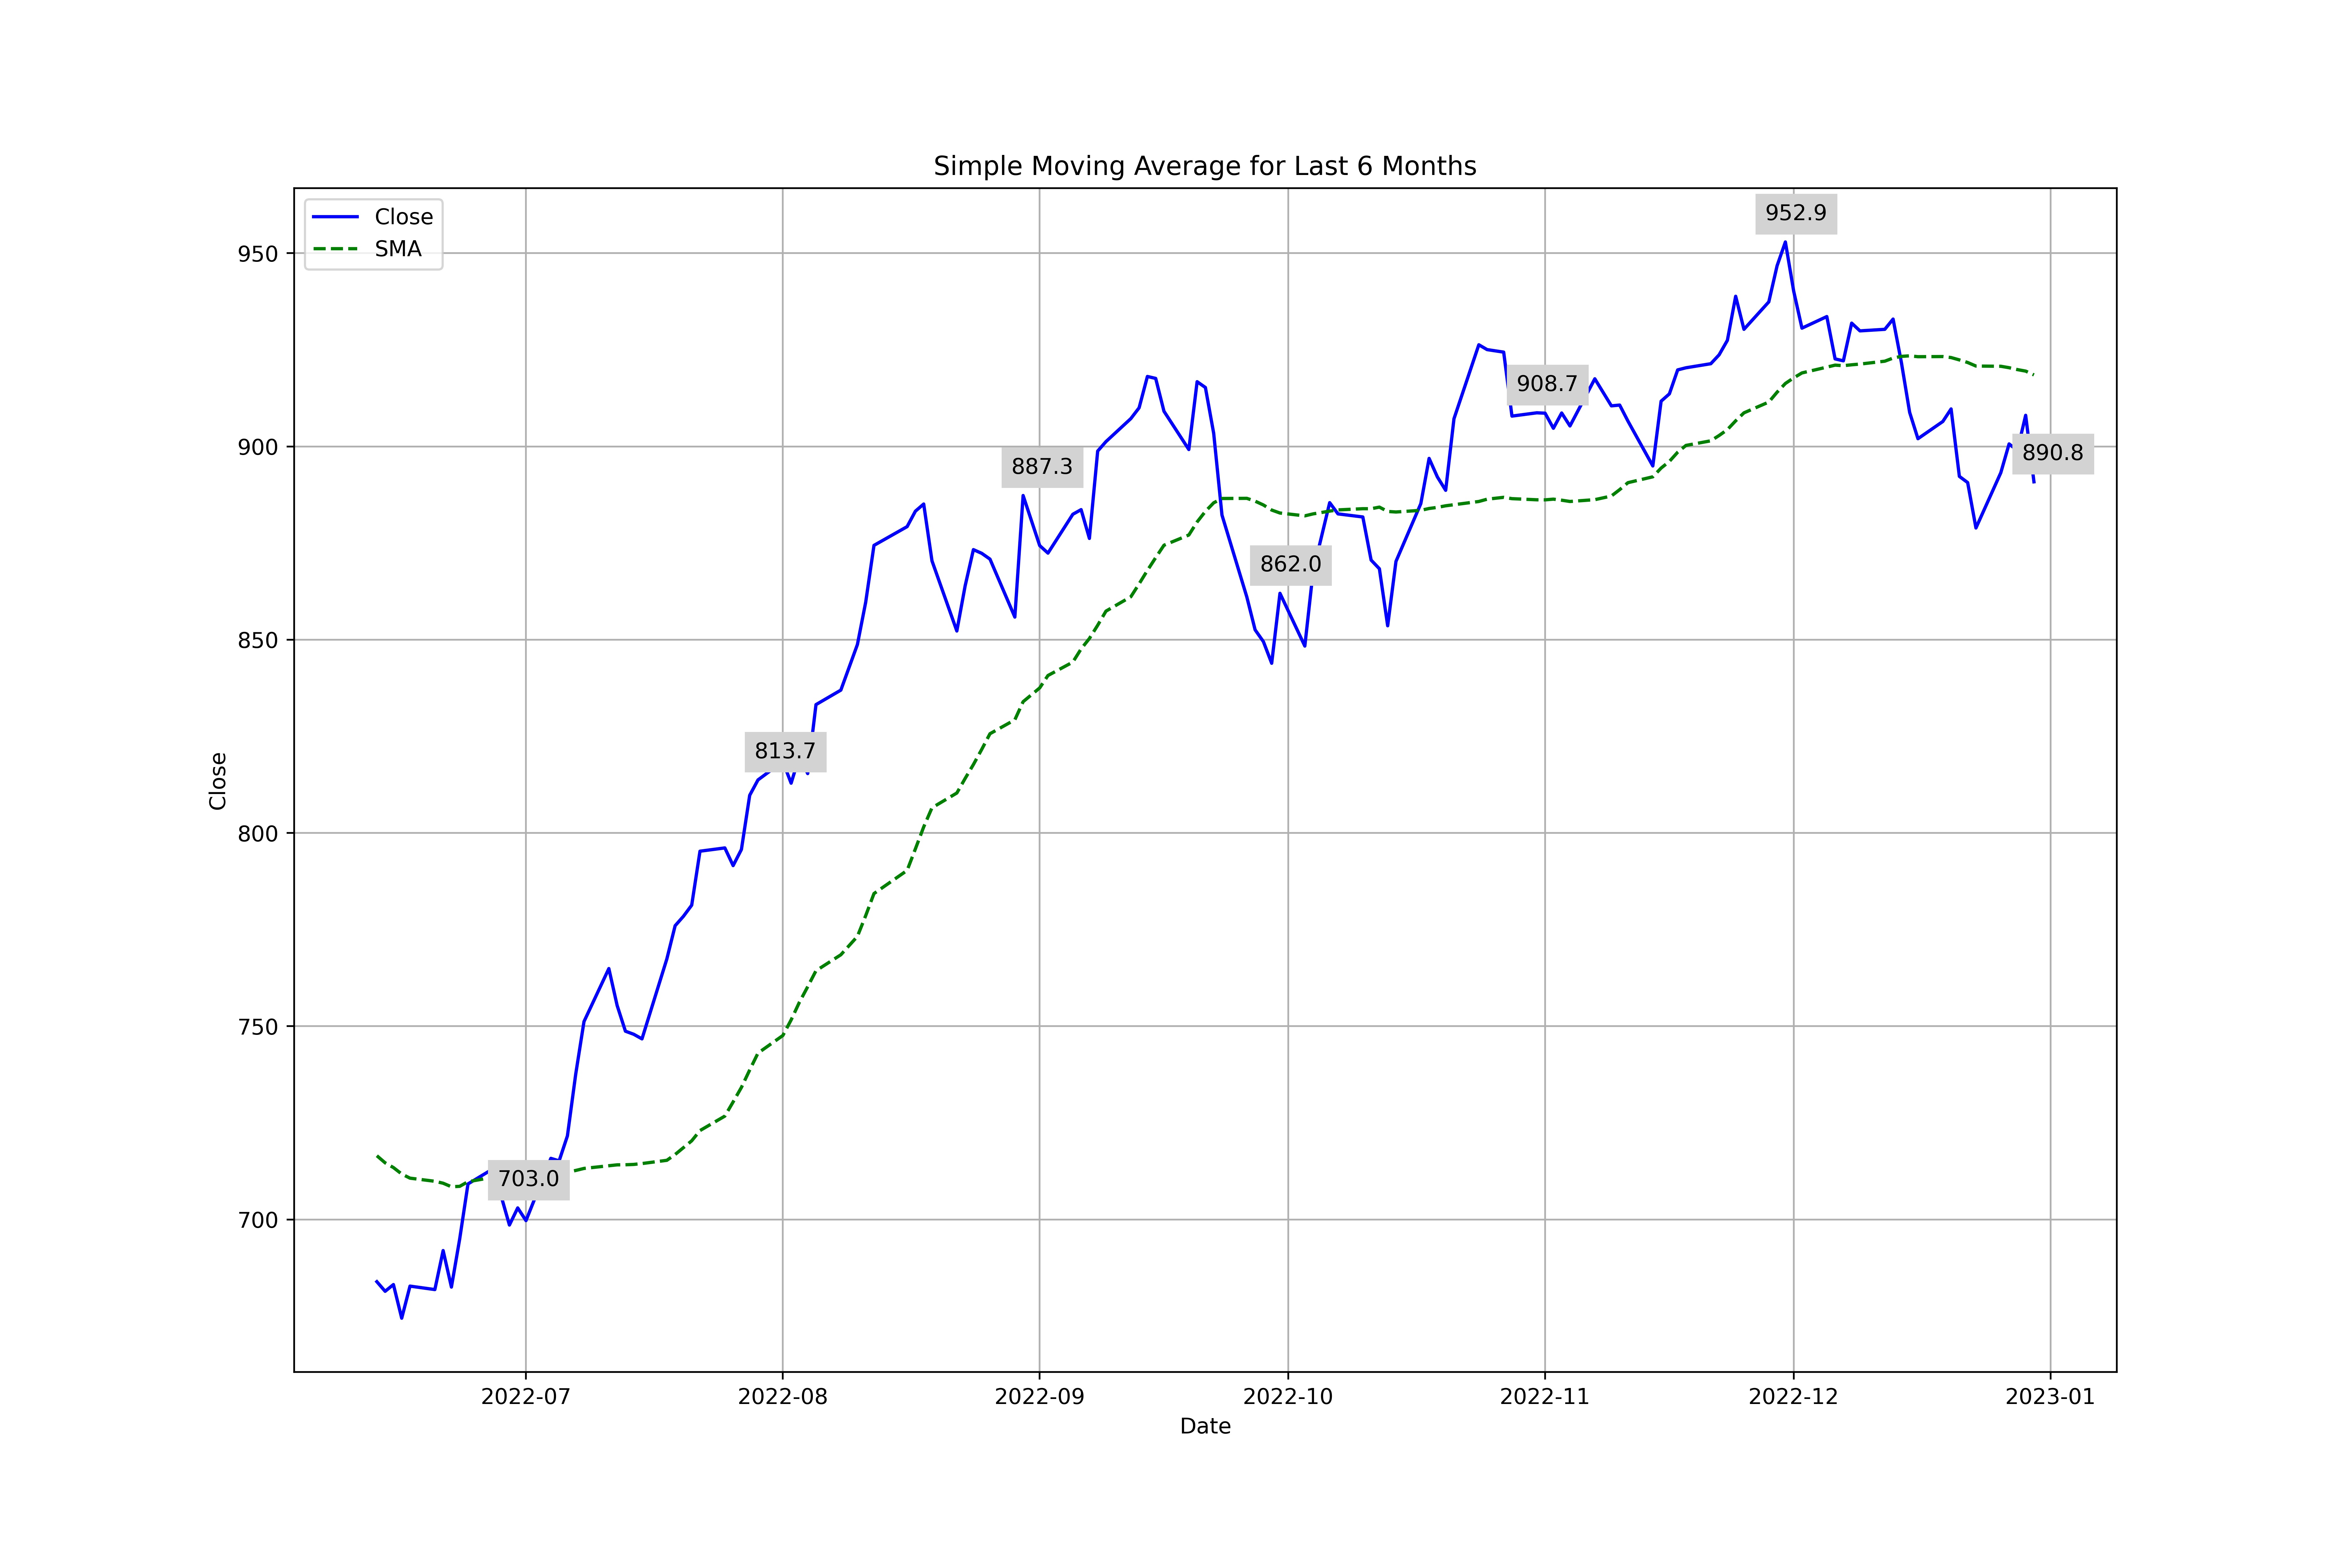
Simple Moving Average for last 6 months

--- THE END ---


