Stock Analysis and Investment Strategy
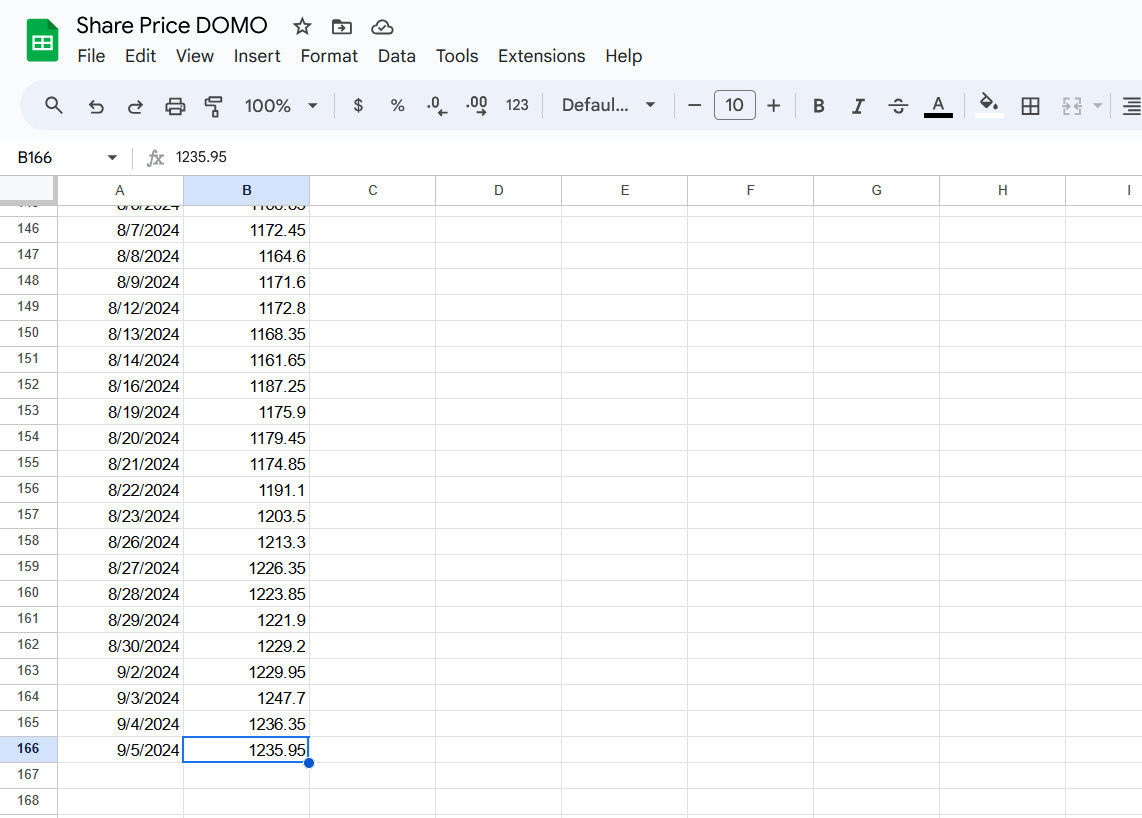
In this project, I leveraged the GOOGLEFINANCE function in Google Sheets to retrieve real-time stock data for analysis.
The data, comprising the last 60 business days of closing prices, was imported into Domo for more in-depth exploration. I used this information to create a frequency distribution chart dividing the prices into 5 bins.
The investment strategy focuses on identifying optimal entry points for stock investment by analyzing price movement. If the last close price lies within the first four bins, there is a higher probability of it moving to the fifth bin, signaling a potential rise.
The raw Google Sheet example
These are some last rows of Google Sheet used in analysis.

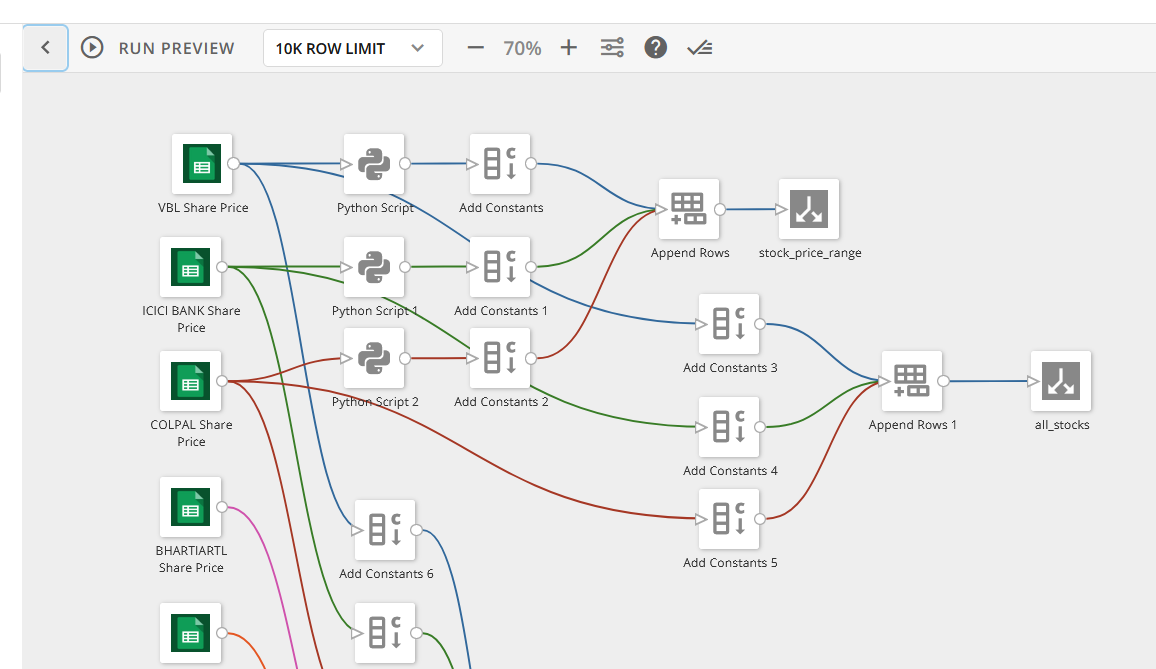
ETL tranformations
Transformations were required to get the distribution results in Magic ETL DOMO.

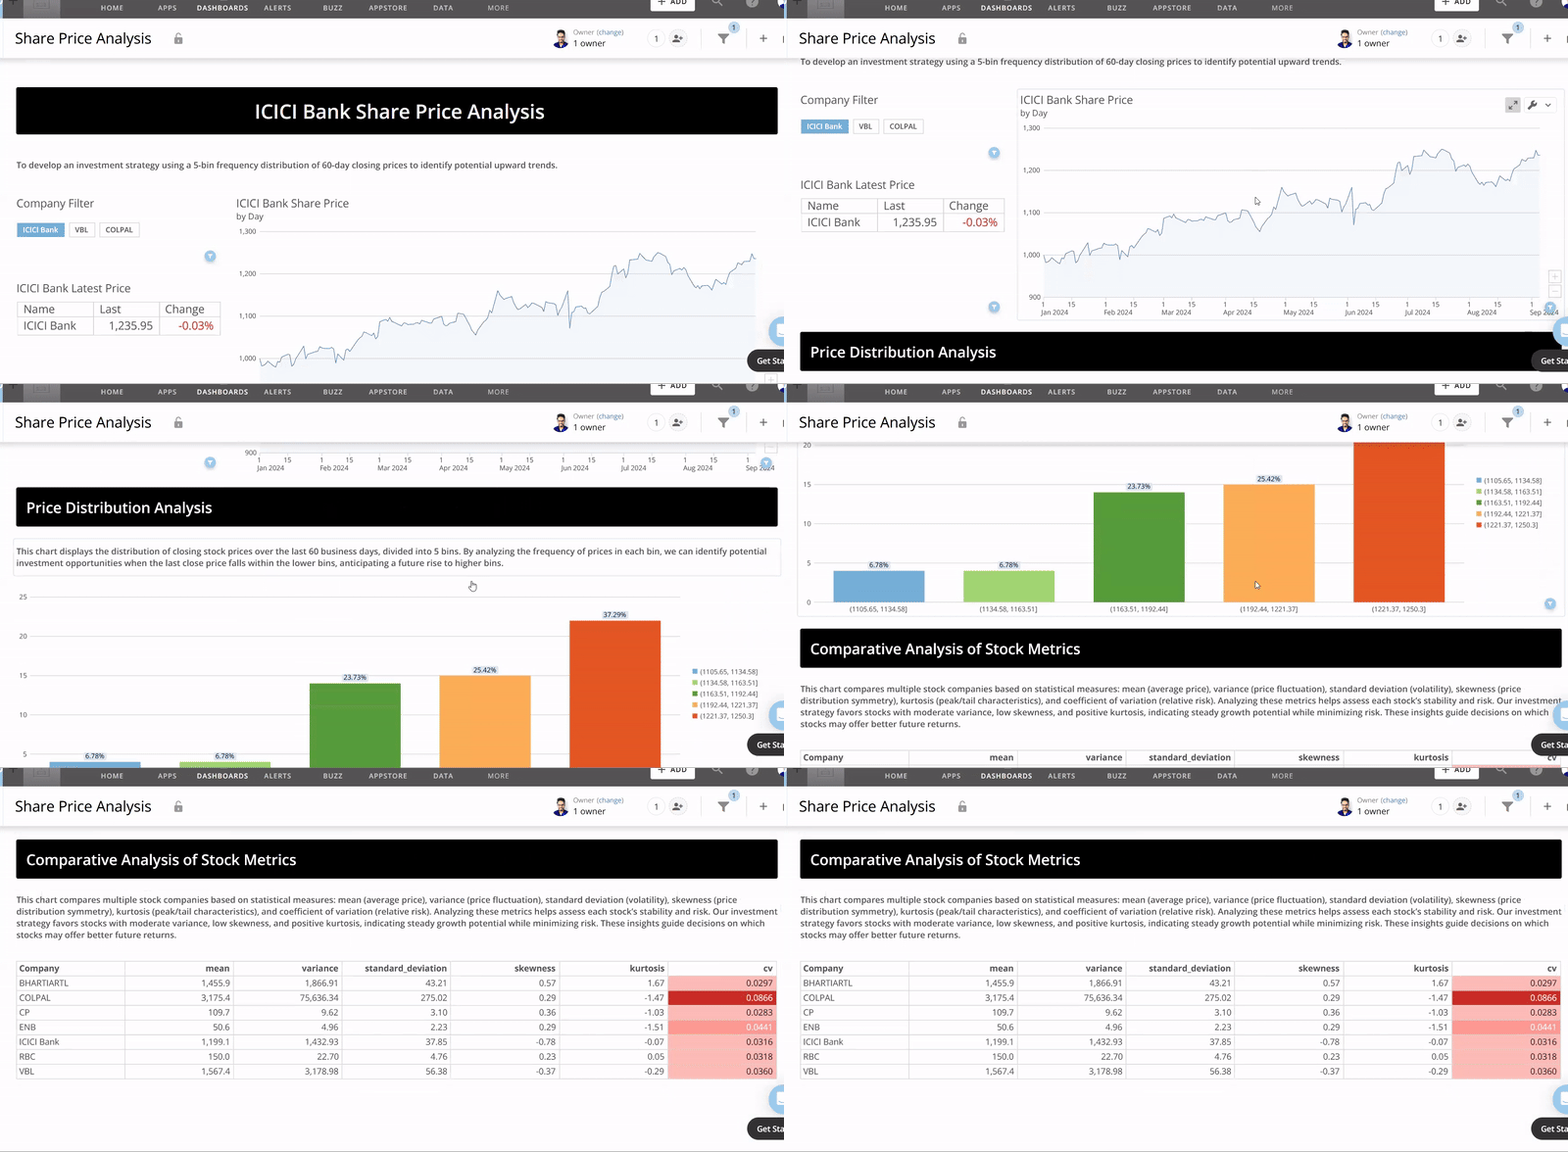
The preview in DOMO
In DOMO the first chart displays the close price of current year and then second chart shows the price distribution of a stock over the last 60 business days, categorized into 5 bins. By analyzing the frequency of prices in each bin, I aim to identify investment opportunities. If the last close price lies in the 1st to 4th bins, I anticipate a potential rise into the 5th bin, signaling a buy moment.
The last chart compares multiple stock companies based on statistical measures: mean (average price), variance (price fluctuation), standard deviation (volatility), skewness (price distribution symmetry), kurtosis (peak/tail characteristics), and coefficient of variation (relative risk). Analyzing these metrics helps assess each stock’s stability and risk.
Our investment strategy favors stocks with moderate variance, low skewness, and positive kurtosis, indicating steady growth potential while minimizing risk. These insights guide decisions on which stocks may offer better future returns.

--- THE END ---


