Analyzing Stock Price Movement
This study examines the existence of repeatable stock price patterns and evaluates their potential for predicting future price movements.
This project specifically examines ICICI Bank’s stock to uncover trends in its daily price movements and gain insight into its behavior over time.
Data Collection
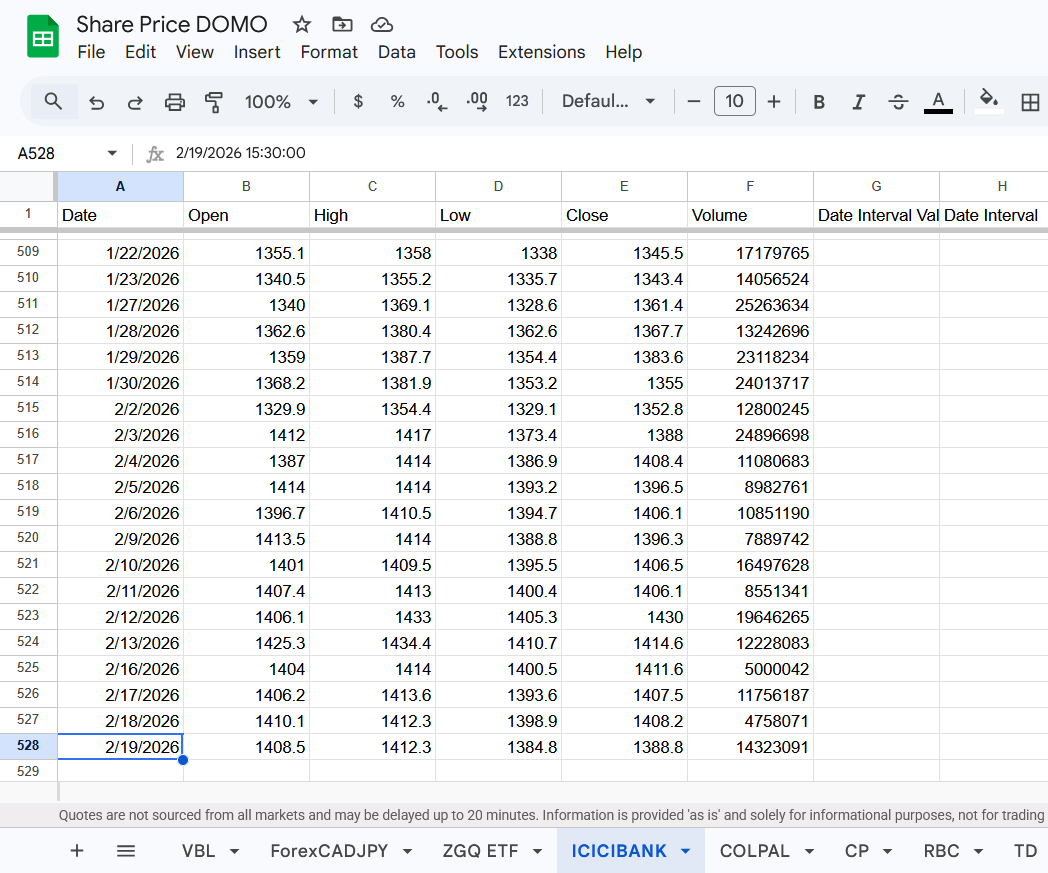
Historical price data for ICICI Bank was obtained using the GOOGLEFINANCE function within Google Sheets. The dataset was generated using the formula: GOOGLEFINANCE.
This query retrieved daily market data—including open, high, low, close, and volume—over the specified date range. The data was then exported and processed for further analysis in Python and DOMO BI Tool.
Methodology / Approach
Rolling Window Construction
For each trading day, the previous 90 trading days were selected to create a rolling observation window. Within this window, the minimum and maximum closing prices were identified, and the total price range was divided into five equal-width bins.
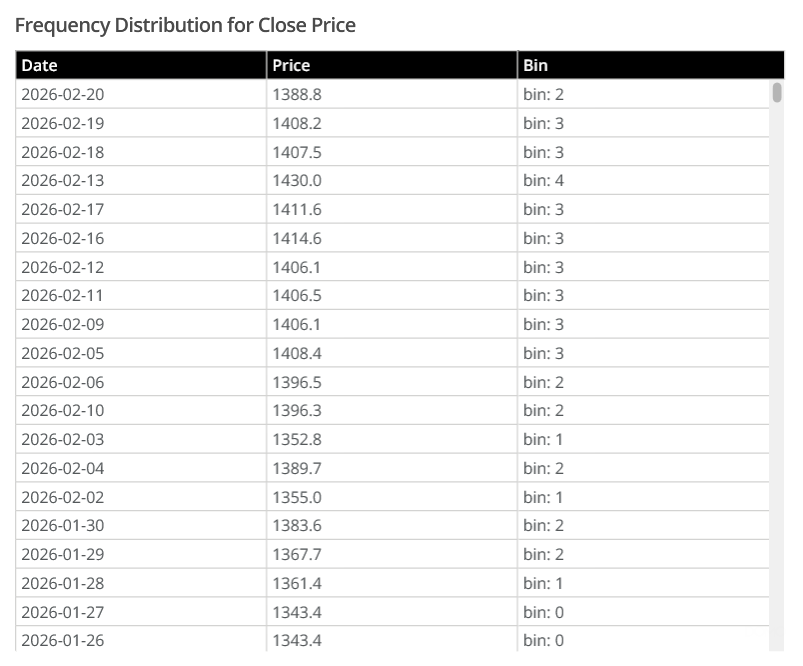
Each day’s closing price was then assigned to one of these five bins (states 0–4). As the window advances one day at a time, the bin thresholds dynamically adjust to recent price behavior. This ensures that the classification remains adaptive to changing volatility and market conditions rather than relying on fixed price levels.
Frequency Distribution
After assigning each trading day to a bin, a time series of discrete states was created. The frequency distribution of these states was then analyzed to understand how often the stock occupied each price range.
This step provided insight into whether the stock exhibited clustering behavior — for example, whether it tended to remain in higher bins during bullish phases or lower bins during consolidations. The distribution also helped evaluate whether the binning method produced balanced state representation over time.
Transition Frequency Analysis
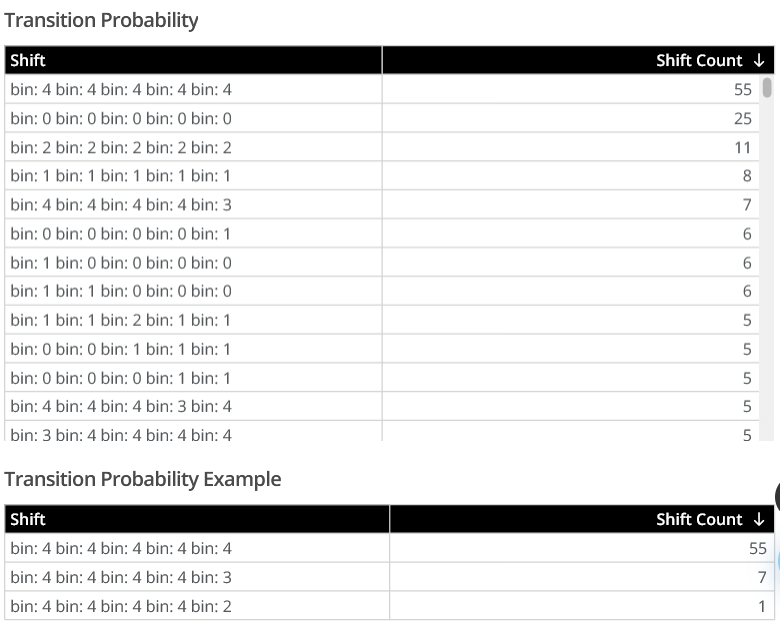
Once the state sequence was constructed, transition frequencies between states were calculated. Specifically, the number of times the stock moved from one bin to another on the next trading day was recorded. From these transition counts, conditional probabilities were computed to evaluate: P(Next State ∣ Current State)
This formed the basis of a first-order Markov-style model, allowing assessment of whether certain states exhibited statistically higher probabilities of upward or downward movement. These transition patterns were later used to generate predictive signals for backtesting.
Key Insights
An example from the transition analysis shows the following observed frequencies for the sequence: The transition analysis reveals a strong persistence effect when the stock remains in the highest price bin (Bin 4) for four consecutive trading days. Specifically, there were 63 historical instances where the sequence (4,4,4,4) occurred. In 55 of those cases, the following day also remained in Bin 4, while only 7 instances moved down to Bin 3 and just 1 instance moved to Bin 2.
This implies that when the stock sustains its position in the upper price range for four consecutive days, it continues to remain in that upper range approximately 87% of the time on the next trading day. In practical terms, this reflects short-term persistence or momentum within the rolling 90-day framework. Rather than immediately reverting, the stock tends to consolidate near its recent highs once it has established strength over multiple sessions.
Summary
This study explored whether short-term repeatable price structures exist within ICICI Bank’s stock using a rolling 90-day framework and discrete state modeling. By transforming continuous price data into adaptive price bins, the analysis converted market movement into a structured state sequence, enabling probabilistic examination of transition behavior.
The rolling window approach ensured that bin classifications adjusted dynamically to evolving volatility, preventing static threshold bias. Frequency distribution analysis provided insight into how the stock occupied different price ranges, while transition frequency analysis enabled construction of a Markov-style probability framework to evaluate sequential dependencies.
The results indicate evidence of short-term state persistence, particularly in extreme bins. For example, when the stock remained in the highest bin for four consecutive days, it continued in the same state approximately 87% of the time. This suggests clustering behavior and potential momentum effects within the defined rolling structure.
Overall, this project demonstrates a systematic approach to transforming raw market data into a probabilistic framework, combining rolling normalization, state classification, transition modeling, and backtesting into a structured analytical pipeline.
Tools Used
Programming & Analysis: Python (Pandas, NumPy), Jupyter Notebook
Data Handling: Google Sheets (GOOGLEFINANCE API), DOMO ETL Pipeline
Methods: Financial & Statistical Concepts
Visualization: DOMO BI Tool, matplotlib, seaborn
--- THE END ---